Attacking Over/Under Performance
Actual Goals vs Expected Goals: Premier League Analysis (season 2023/24)
Executive Summary
This report explains, in simple terms, the steps we followed to build a chart that compares each Premier League team's actual goals scored (GF) to the goals they were expected to score (xG) in the 2023-2024 season. The chart shows which teams scored more than expected (overperformed) and which scored less (underperformed).
Understanding the Data
We will not describe the data in detail as everything is clearly documented in the link below (see source of our data).
Source
Premier League Data Library [https://pypi.org/project/premier-league/#matchstatistics]
Features
1. Match Statistics
MatchStatistics is a class for retrieving and analyzing detailed match-level statistics in the form of ML datasets from Premier League games and other top European leagues. It provides access to extensive game data including team performance metrics, player statistics, and match events for ML training or analysis.
Data Structure: The data is stored in a SQLite database [premier_league.db]
Core Tables: League, Team, Game, GameStats
2. RankingTable
RankingTable fetches team ranking data for a given season and league.
Scope
League: English Premier League
Season: 2023-2024
Units compared:
- Goals For (GF): actual goals scored by a team across the season
- Expected Goals (xG): a modelled number that estimates how many goals a team should have scored given the quality and number of their chances
Limitations
- xG is an estimate: xG approximates the quality of chances but is not perfect. It does not capture every contextual factor (e.g., individual finishing skill, deflections, refereeing decisions).
- Aggregation: Summing xG across a season is standard but hides game-by-game variation; some teams may overperform in certain matches and underperform in others.
- Database accuracy: The visualisation is only as accurate as the database records.
Approach
1. Calculating Goals For (GF) and Expected Goals (xG)
o Due to the large amount of data across multiple tables, it was more efficient to use PostgreSQL and join only the information required, so we initialized the database locally as per the documentation instructions.
o The necessary data were later added to a DataFrame for sanity checks and further manipulation.
o We pulled match-level data from the database for every game in the 2023-2024 Premier League season.
o For each team we added up:
- The total goals they scored across all games (GF).
- The total expected goals (xG) recorded for that team (xG).
2. Retrieving the final standings
Due to the smaller amount of data, we directly loaded the information into a Pandas DataFrame.
3. Final Ranking Table including xGs
We merged the two DataFrames above into a single one which we would later use for data checks and visualisation.
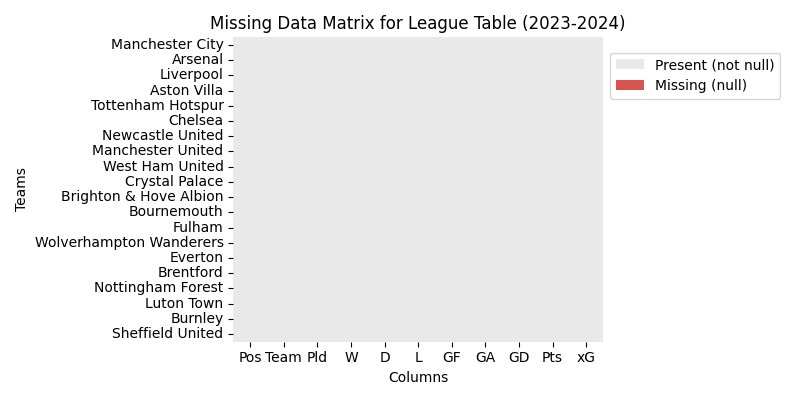
4. Check for missing data
Our data set is complete and there is no data missing.
5. Visualisation of attacking output per team
Layout:
- Each team is shown on its own horizontal row, ordered by final league position (top teams at the top).
- The x-axis is "Goals".
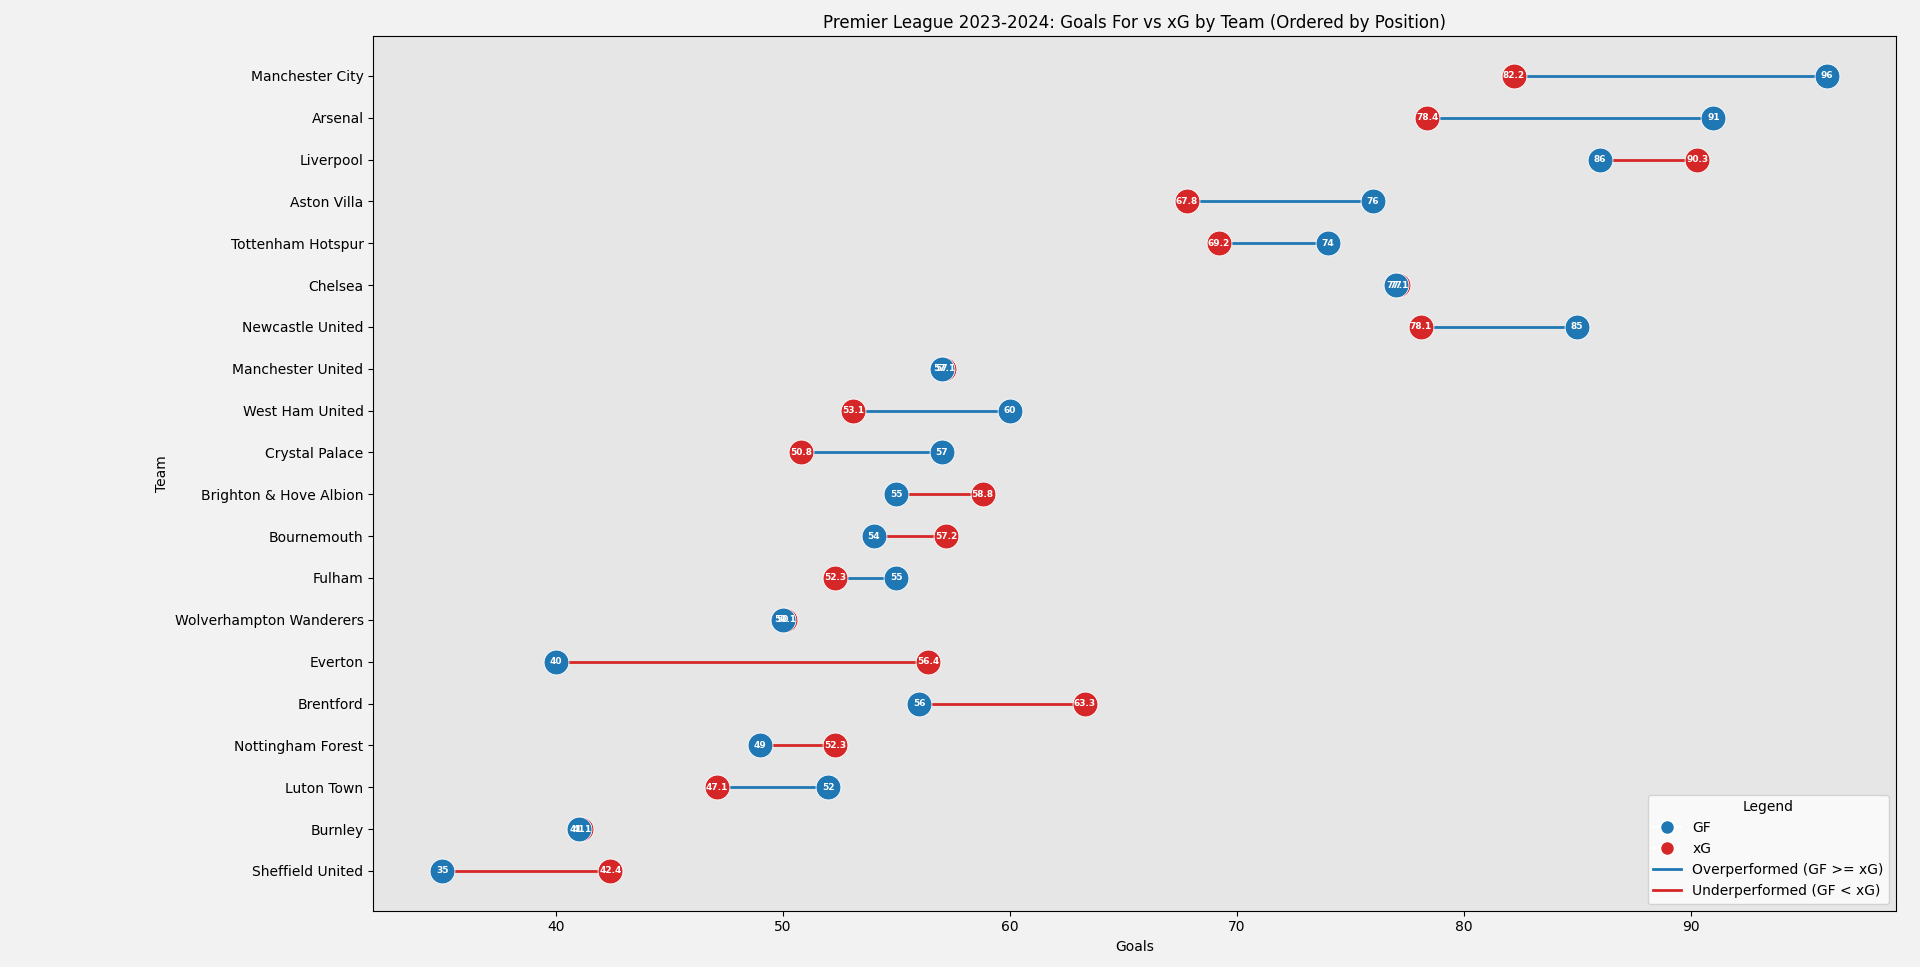
Teams that overperformed (GF >= xG):
- Manchester City: GF=96, xG=82.2, diff=13.8
- Arsenal: GF=91, xG=78.4, diff=12.6
- Aston Villa: GF=76, xG=67.8, diff=8.2
- Newcastle United: GF=85, xG=78.1, diff=6.9
- West Ham United: GF=60, xG=53.1, diff=6.9
- Crystal Palace: GF=57, xG=50.8, diff=6.2
- Luton Town: GF=52, xG=47.1, diff=4.9
- Tottenham Hotspur: GF=74, xG=69.2, diff=4.8
- Fulham: GF=55, xG=52.3, diff=2.7
Teams that underperformed (GF < xG):
- Everton: GF=40, xG=56.4, diff=-16.4
- Sheffield United: GF=35, xG=42.4, diff=-7.4
- Brentford: GF=56, xG=63.3, diff=-7.3
- Liverpool: GF=86, xG=90.3, diff=-4.3
- Brighton & Hove Albion: GF=55, xG=58.8, diff=-3.8
- Nottingham Forest: GF=49, xG=52.3, diff=-3.3
- Bournemouth: GF=54, xG=57.2, diff=-3.2
- Manchester United: GF=57, xG=57.1, diff=-0.1
- Burnley: GF=41, xG=41.1, diff=-0.1
- Wolverhampton Wanderers: GF=50, xG=50.1, diff=-0.1
- Chelsea: GF=77, xG=77.1, diff=-0.1
Why this is useful
Expected goals (xG) gives a sense of how many good scoring opportunities a team created. Comparing GF to xG helps separate:
- Teams who were lucky or had particularly good finishing (GF > xG).
- Teams who created chances but failed to finish (GF < xG).
This helps coaches, analysts and fans understand whether a team's scoring record was sustainable or might regress toward the xG level in the future.
How Final Rank Relates to GF − xG
Scatterplot of each team's final league position (x) against their GF − xG (y); blue = overperformed, red = underperformed. Positive y means scored more than expected.
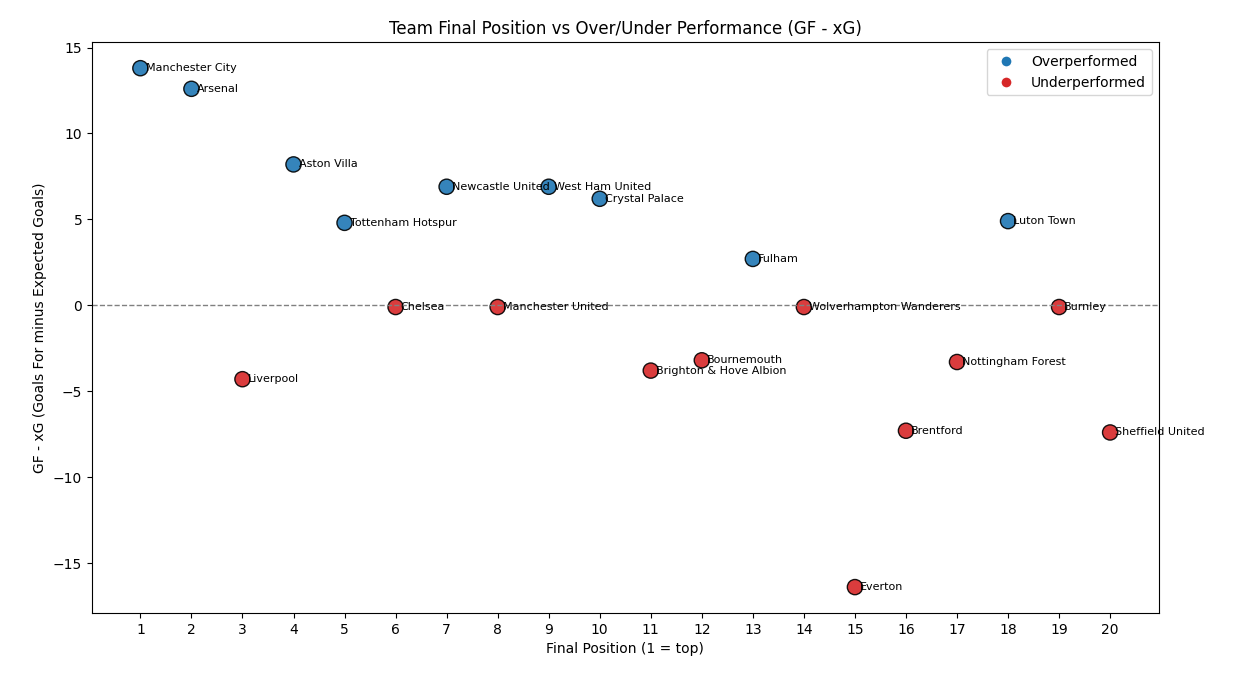
Scatterplot shows a weak negative/positive relationship, with notable outliers such as Liverpool (3rd / diff=-4.3) and Luton (18th / diff=+4.9), suggesting that goal over/underperformance only partially explains final league position.
Summary
The analysis of GF vs xG differences gives useful insight, but it's not the whole story. Goals scored relative to expected goals helps explain finishing quality or luck, while final league position is driven by points (wins/draws/losses) which also depend on defence, consistency and game management.
It does however explain an important part of how teams ended up where they did: big positive gaps boosted some teams' attacking output and helped top sides, while big negative gaps (notably Everton) aligned with poor outcomes. But final league position is multifactorial — to make stronger causal claims we should continue our analysis and combine GF/xG with defensive stats and points-based analysis.